
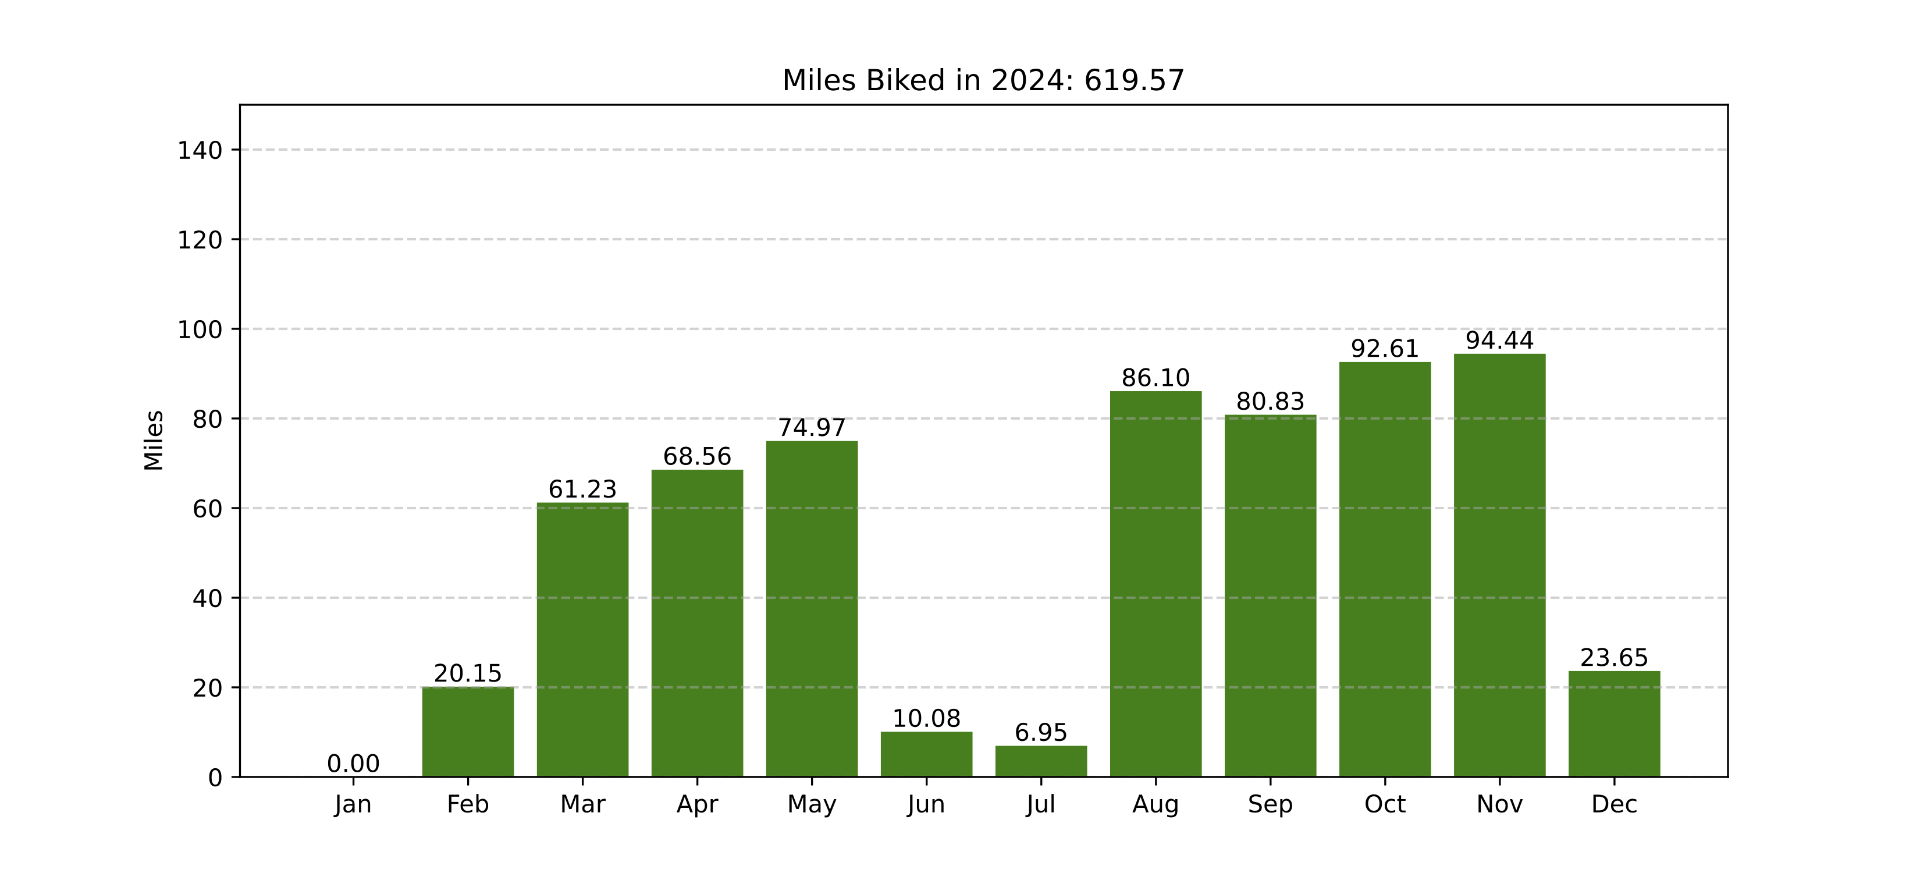
I managed to bike over 500 miles in 2024 and I wrote a post about it. In that post I used screen shots from RunGap which is a great mobile app that imports data from the Apple Fitness stats captured by my watch and phone.
I don’t love the screen shot thing so I figured I should work on some code to make my own bar graphs. I used Matplotlib for Python to do the heavy lifting here. Matplotlib is complex and powerful so I really just started by ducking for python bar graph and found a few pages with examples and started there.
Also, I can’t decide if this post is about Bikes or Python, so it will be both.
After riding 600 miles in 2024 and seeing that I barely rode in four of those months (due to weather, travel, being sick, etc) I set a goal of 1,000 miles for 2025. This works out to about 84 miles each month, or just under 3 miles per day. I figured I could ride 5 miles most days, and double that on a weekend day. So even if I just rode weekends and got about 20 miles per weekend I’d be most of the way there.
I should mention that years ago I would have never imagined trying to bike 1,000 miles in a year. But I guess it’s not too different from walking. I think I did just a few rides in 2024 that were over 10 miles but that’s a regular thing for me now on weekend days.
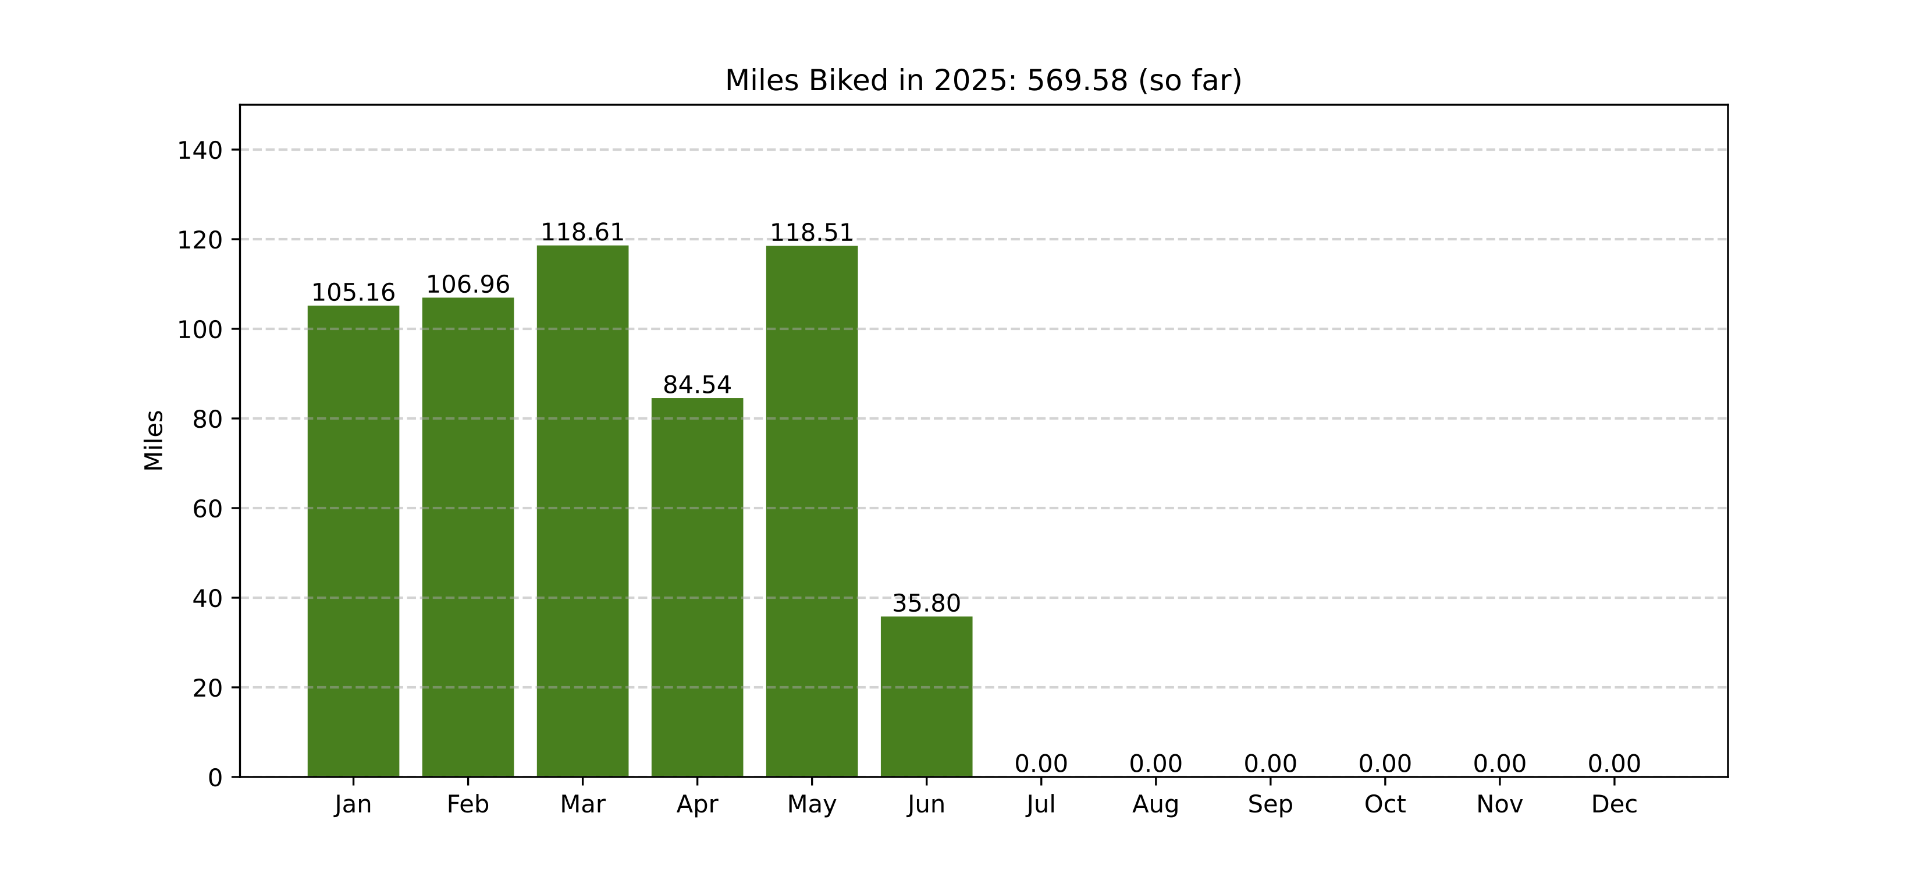
Here’s my progress for 2025 so far – 569.58 miles. You’ll see April was a bit lower, which was due to work travel. I did also travel in May but I worked overtime to make up for it before and after my trip. I don’t have any other travel planned for this year, and hopefully I can avoid injuries and sickness. I should easily hit 600 before the end of the month, which is the halfway point for the year so… on track!
There’s a lot more data in RunGap, and I can access it via the SQLite database the app uses, so I may try to pull data directly from that, and maybe add in some graphs for other things, like hours biked, etc. And yes, many of the miles during the colder (or rainy) months were indoors on the trainer (Dana’s bike!) but I definitely prefer to get outside and ride when I can.
So here’s to more miles on the bike and more lines of code to create graphs!
See Also: milesBiked – A Bar Graph Generator


