Categories
Uncategorized

milesBiked – A Bar Graph Generator

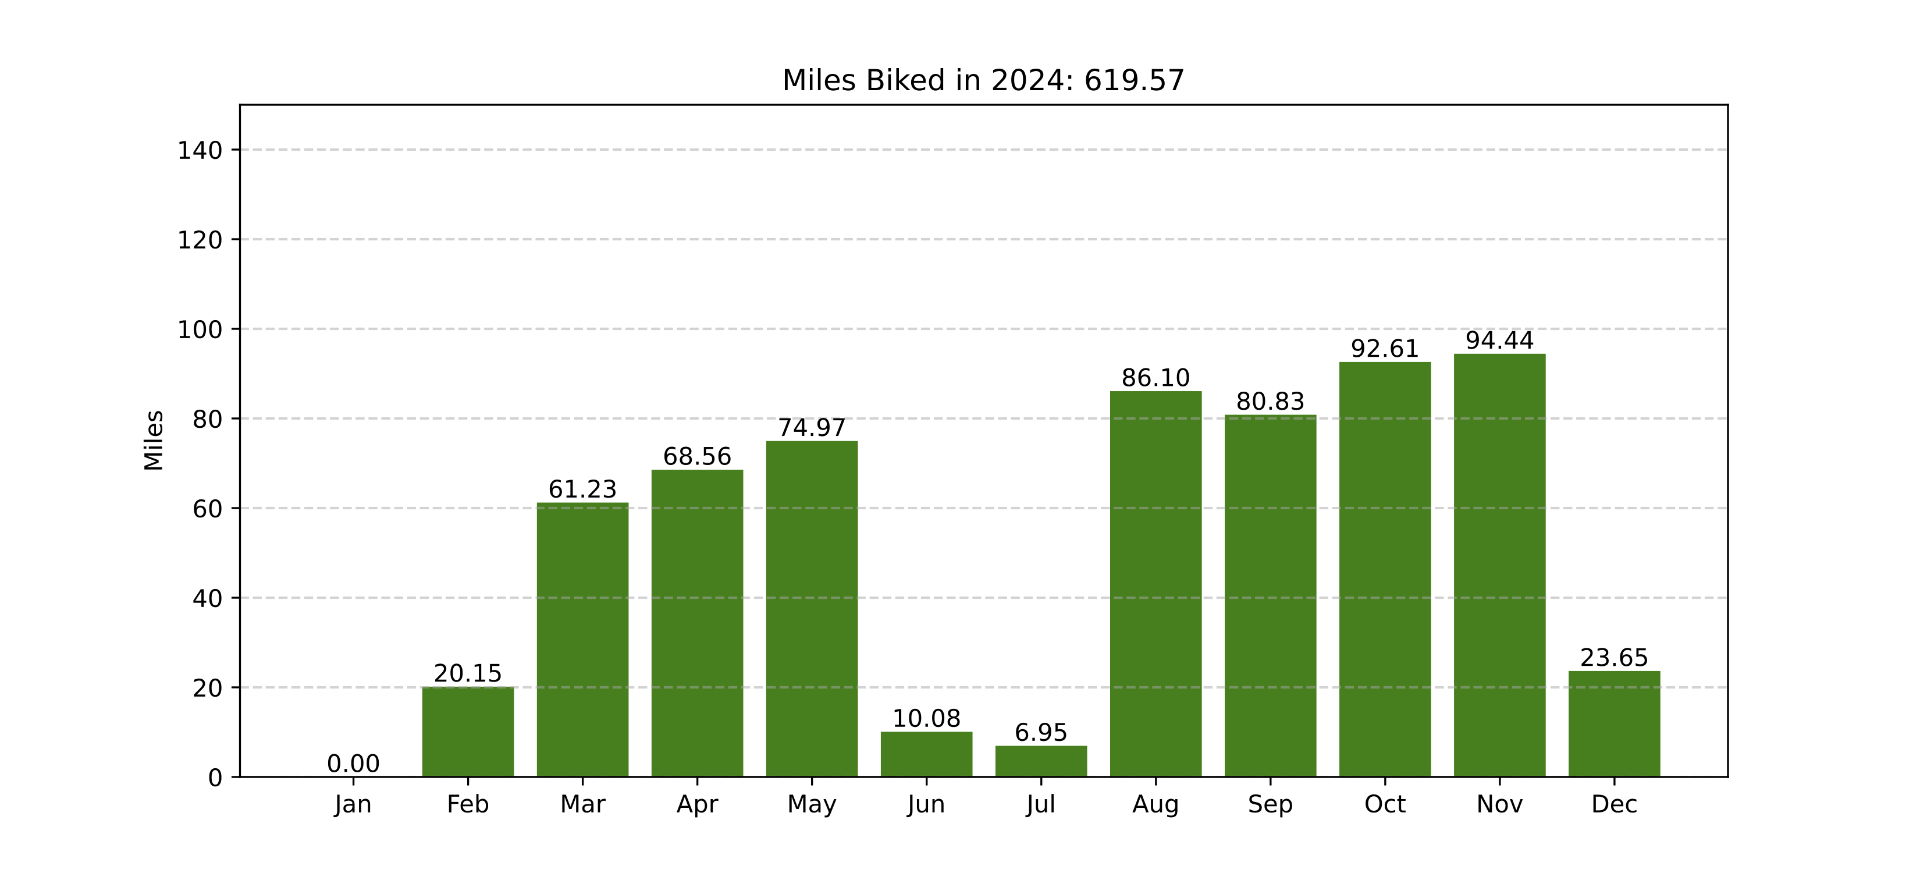
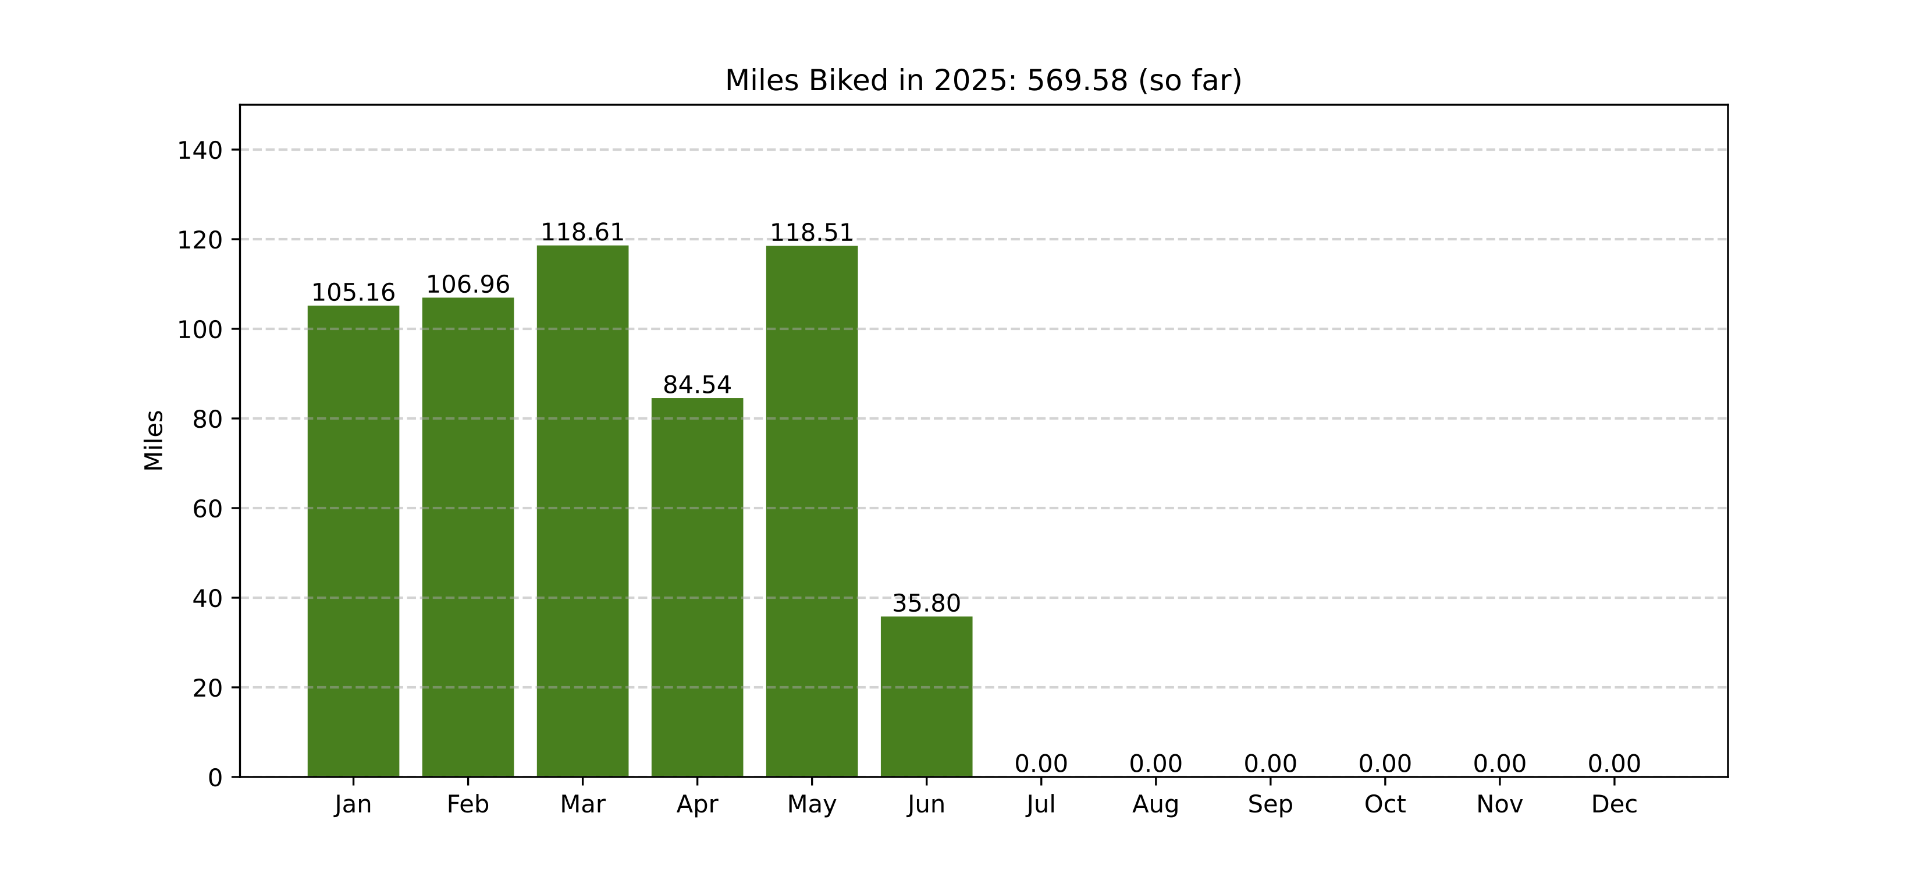
In a previous post titled Miles Biked (so far)… I talked about generating bar graphs to show how many miles I biked. And in the post before that I suggested you Share Your Code. So this post is the logical conclusion.

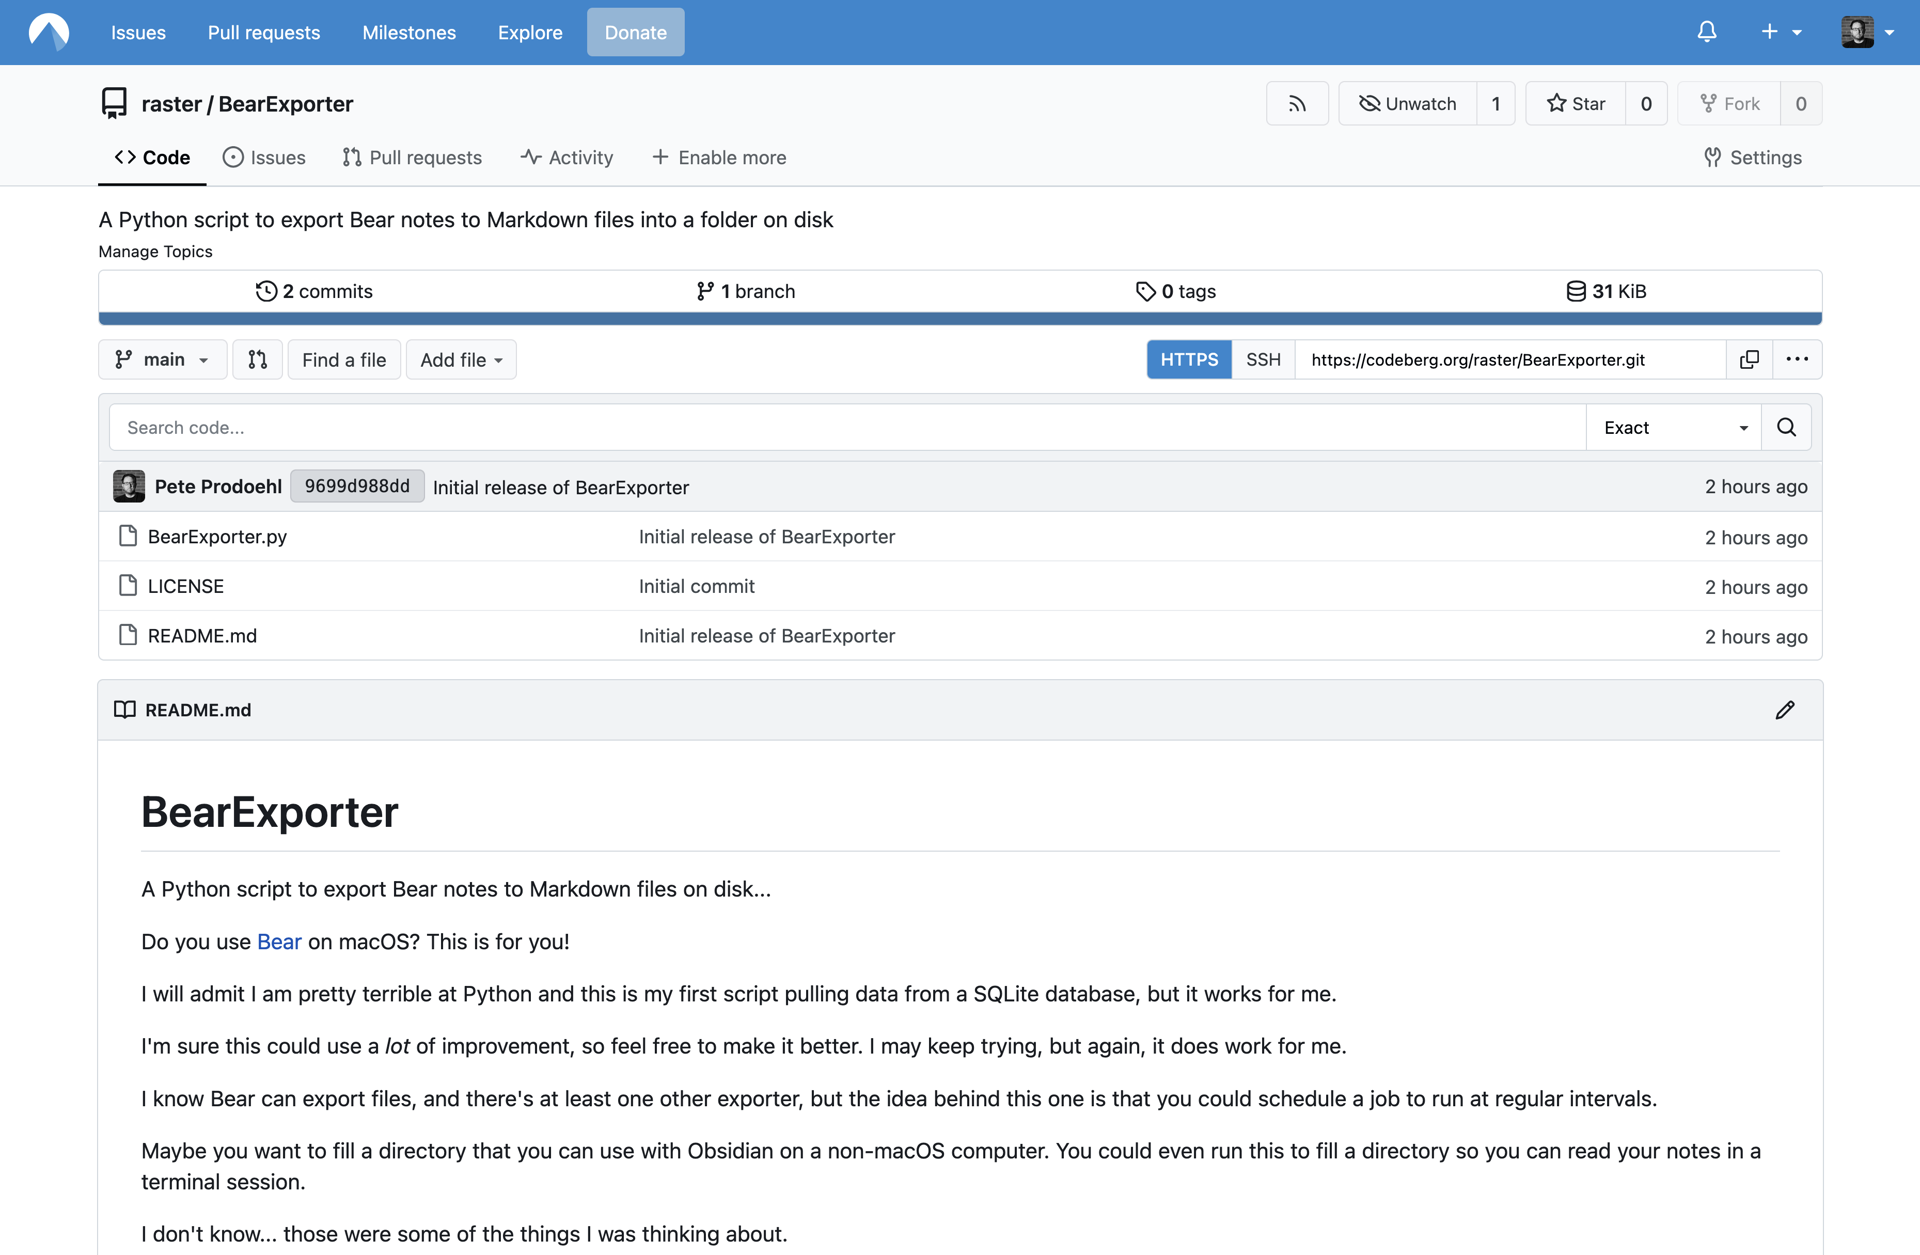
You can find milesBiked on Codeberg, a community-led platform that offers Git hosting and other services for free and open source projects. Codeberg is a non-profit organization based in Berlin, Germany, that respects privacy, supports the commons and celebrates creativity.

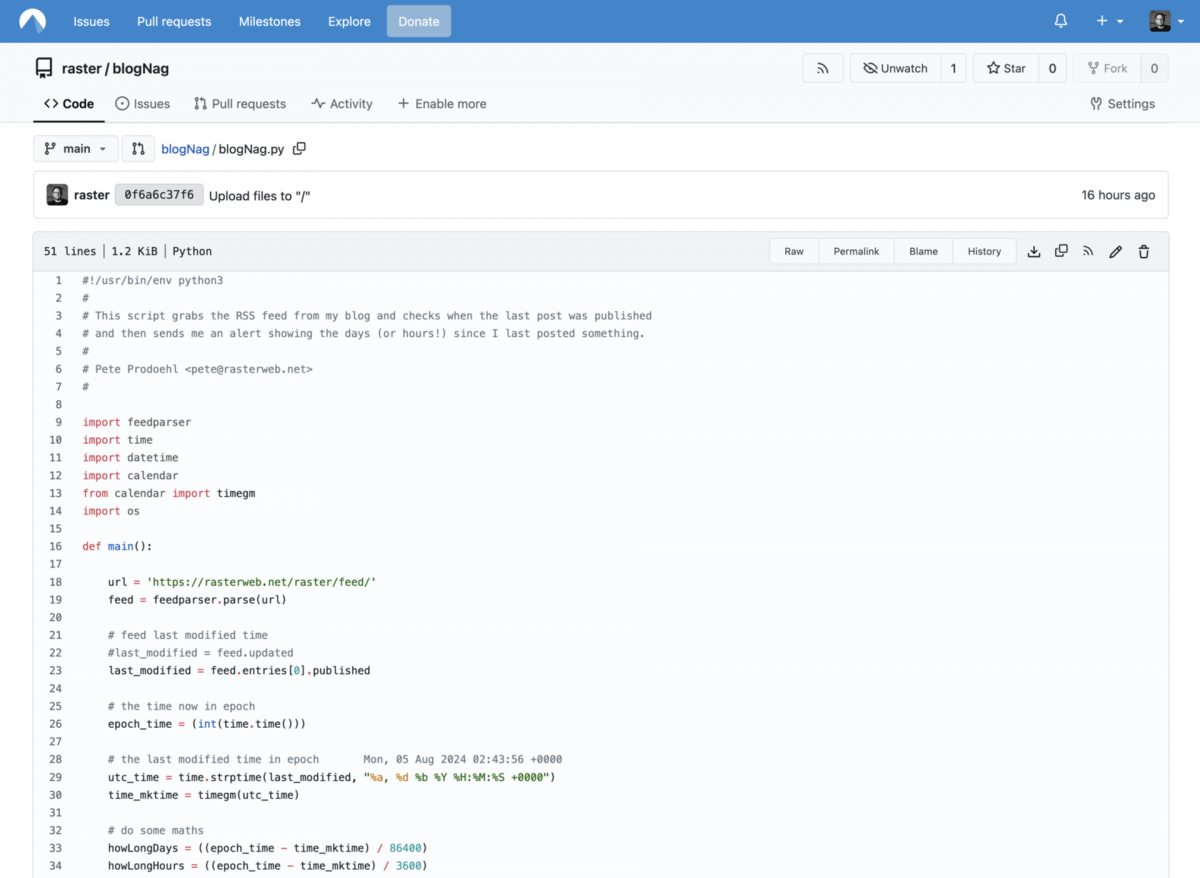
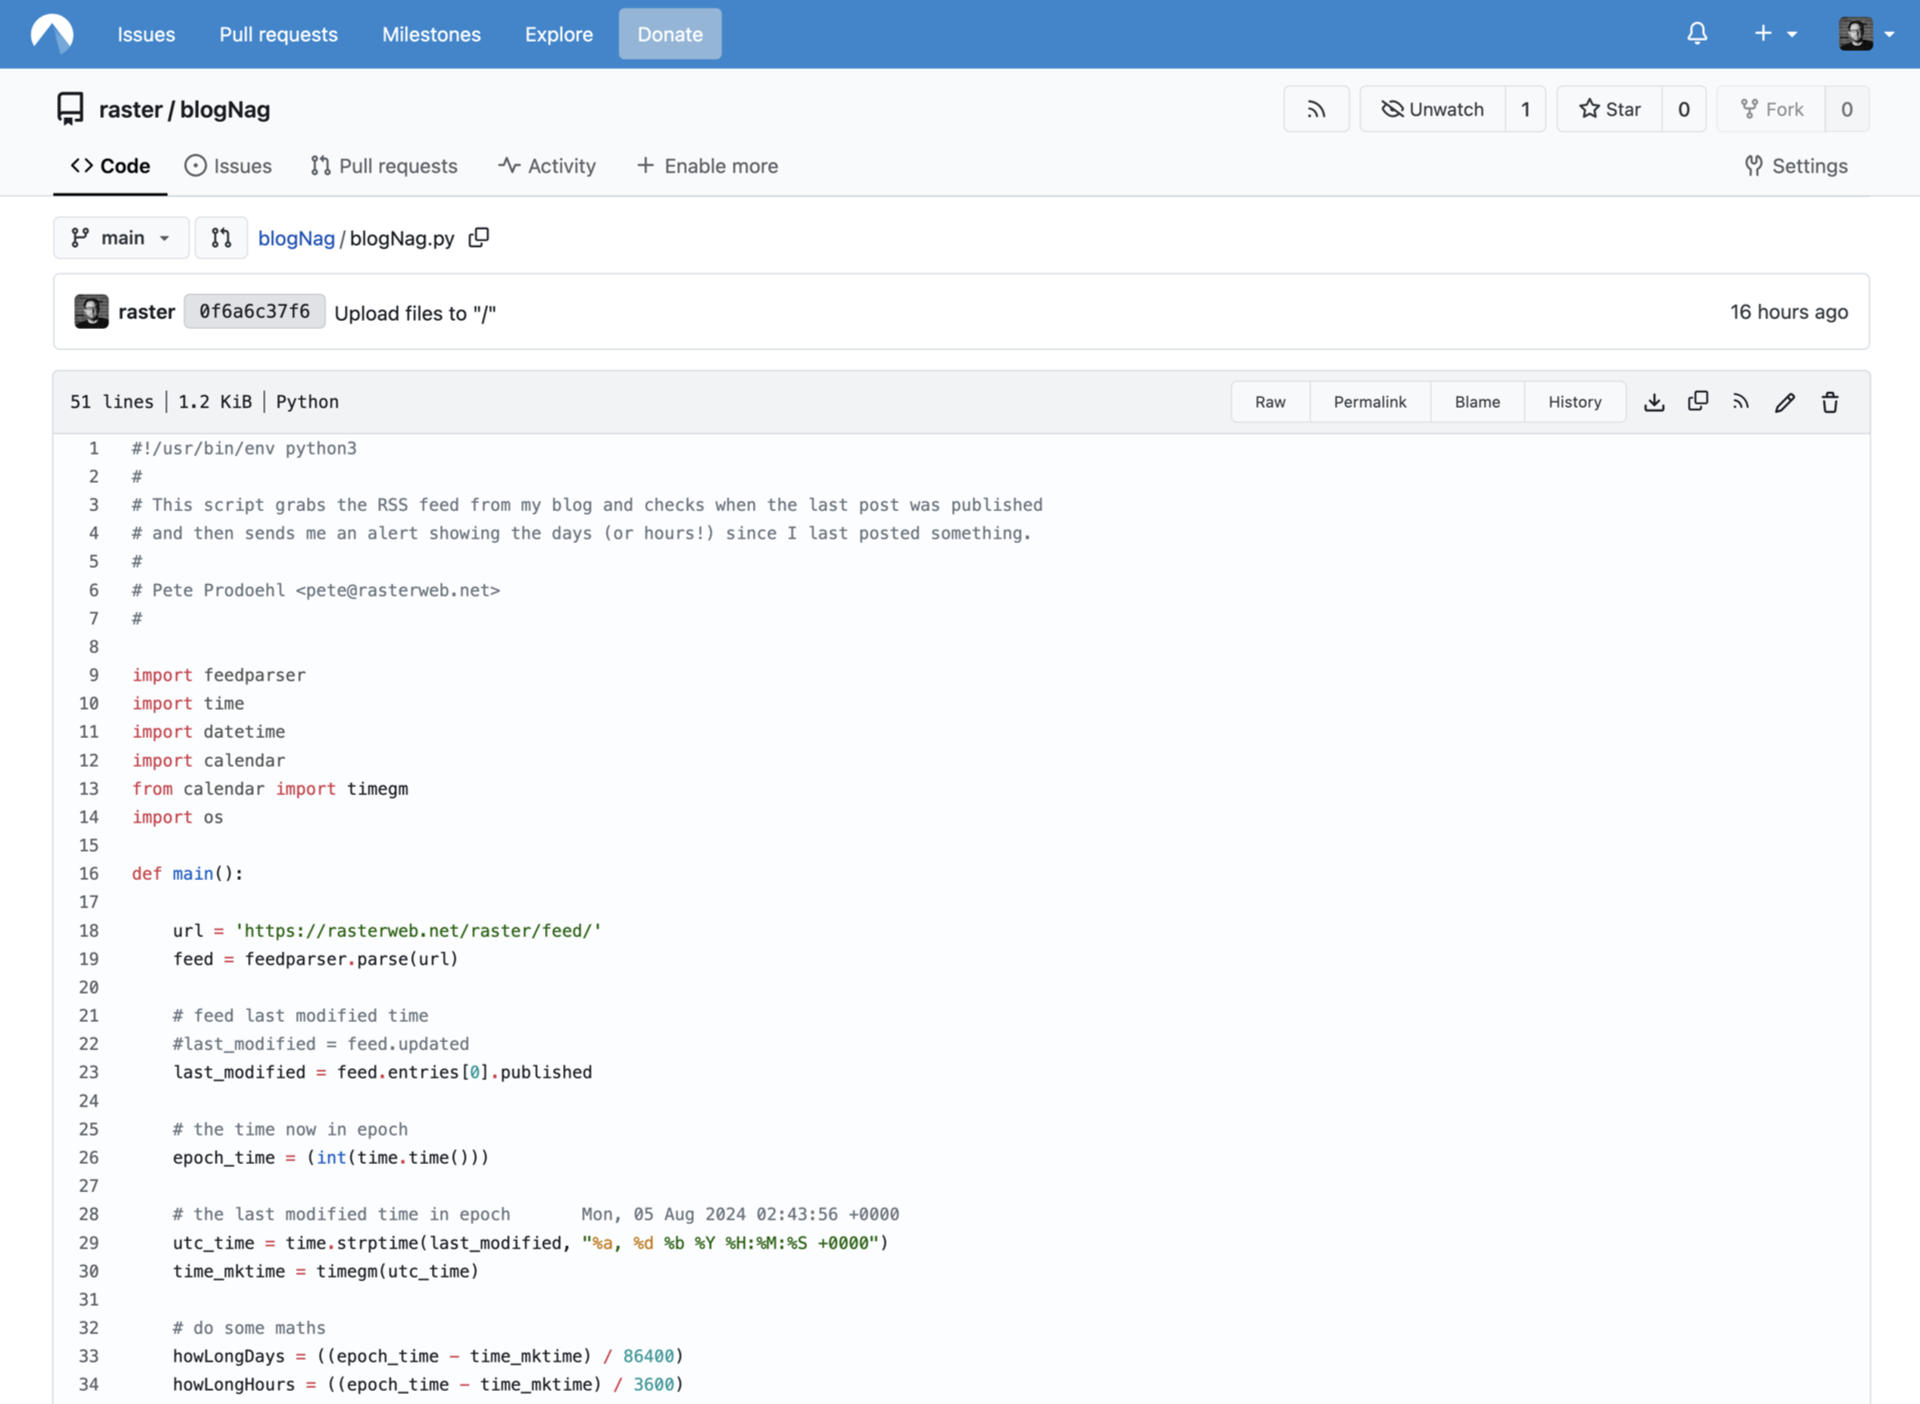
When I posted about blogNag – A Blog Post Reminder I decided I should try to do more to share the code I write. It’s not amazing, it’s not worthy of praise, but it’s code that works for me, solves a problem, and others might be able to use it to learn from. In the age of AI, LLMs, and “vibe coding” I think this is important.

In a world where so many applications are subscription-based, or the free version has limitation that can only be unlocked by paying, releasing free software and open source software to the world can be seen as an act of resistance… or rebellion, even.

Code given freely is a gift to the world. I expect no remuneration for the code I share. Save it for larger projects with more impact. I donate to a number of larger software projects that I use all the time. Inkscape, OpenSCAD, CryptPad, and others… Tools I use almost daily that have allowed me to escape restrictive commercial software. Send your money where it will help the most.

Right, so I learned a bit about Matplotlib and used my basic Python skills to write about 25 lines of code… but I stand on the shoulders of giants. Those who created Python, who documented it, the Matplotlib authors, and the people who wrote articles, blog posts, forum posts, and tutorials with example code that made it all very easy for me.

Good software isn’t created in a void… and it’s not created by telling a machine what you want your code to do. It’s created by people like you. Let’s all work together to make a better world.

Categories
Uncategorized

Miles Biked (so far)…

I managed to bike over 500 miles in 2024 and I wrote a post about it. In that post I used screen shots from RunGap which is a great mobile app that imports data from the Apple Fitness stats captured by my watch and phone.

I don’t love the screen shot thing so I figured I should work on some code to make my own bar graphs. I used Matplotlib for Python to do the heavy lifting here. Matplotlib is complex and powerful so I really just started by ducking for python bar graph and found a few pages with examples and started there.

Also, I can’t decide if this post is about Bikes or Python, so it will be both.

After riding 600 miles in 2024 and seeing that I barely rode in four of those months (due to weather, travel, being sick, etc) I set a goal of 1,000 miles for 2025. This works out to about 84 miles each month, or just under 3 miles per day. I figured I could ride 5 miles most days, and double that on a weekend day. So even if I just rode weekends and got about 20 miles per weekend I’d be most of the way there.

I should mention that years ago I would have never imagined trying to bike 1,000 miles in a year. But I guess it’s not too different from walking. I think I did just a few rides in 2024 that were over 10 miles but that’s a regular thing for me now on weekend days.

Here’s my progress for 2025 so far – 569.58 miles. You’ll see April was a bit lower, which was due to work travel. I did also travel in May but I worked overtime to make up for it before and after my trip. I don’t have any other travel planned for this year, and hopefully I can avoid injuries and sickness. I should easily hit 600 before the end of the month, which is the halfway point for the year so… on track!

There’s a lot more data in RunGap, and I can access it via the SQLite database the app uses, so I may try to pull data directly from that, and maybe add in some graphs for other things, like hours biked, etc. And yes, many of the miles during the colder (or rainy) months were indoors on the trainer (Dana’s bike!) but I definitely prefer to get outside and ride when I can.

So here’s to more miles on the bike and more lines of code to create graphs!

Categories
Uncategorized

BearExporter

Codeberg release

I released the code for a Python script called BearExporter over on Codeberg.

It’s a Python script to export all of your Bear notes to Markdown files you can use with Obsidian, read in the terminal, or whatever. I originally started on this when I started using the MintBook and realized I did not have a good way of seeing any of my notes from a Linux computer.

And yes, you can export your notes in plenty of other ways, the idea with this script is that you can automate/schedule it to run whenever you want, as often as you want, for up-to-date files wherever you might need them.

As the old saying goes “it works for me!” but I know it’s not amazingly well-written code, but it is available. I’m not exactly skilled at Python but I’ll try to improve it as time allows.

The README file probably goes way too in-depth about all the shortcomings. There are times I’m proud of the code I write, and then there are times I get something to (barely) work for me and figure others might find a use for it.

I originally tried this bear_backup script but it wasn’t what I was after. But maybe it’s what you need? I should probably steal/borrow a few ideas from it to enhance my code.

Anyway, enjoy the code, use it ignore it, improve it, or tell me what to do better. :)

Categories
Uncategorized

blogNag – A Blog Post Reminder

I recently released blogNag which is a Python script I run once per day via a cron job to notify me how long it has been (in days or hours) since I last wrote a post on this blog. This forces me to think “Hmm, I should write another post…”, thus promoting a cycle of continuous blogging.

I remember back around 2000 so some bloggers had this idea to “bug” each other if they didn’t post for a while. This is the modern day version of that, since most of the 2000 bloggers have stopped long ago. ;p

It uses feedparser and I remember having some issues getting that installed in the past so I set up a virtualenv for Python. I had these two links for notes: venv — Creation of virtual environments and How to Set Up a Virtual Environment in Python – And Why It’s Useful

My short version for setting up a venv since I will probably forget by the time I need to do it again…

mkdir blogNag
python3 -m venv ./blogNag
cd blogNag
./bin/pip3 install feedparser
# now we can run
./bin/python3 ./blogNag.py

Look, I’m not great at Python but It Works For Me.

Also, this is on Codeberg because I don’t plan on putting any of my personal work on GitHub in the future if I can avoid it. (Microsoft acquired GitHub and I prefer not to support them if possible. Others can make their own choices in the matter, and I won’t judge!)

You’ll probably want to change the code to look for your own feed and do your own notification thing… Again, it works for me, YMMV and all that. Enjoy!

Categories
Uncategorized

DotBot (Another Mastodon Bot)

Well, it’s been two weeks since I wrote about the @WeShouldBuild bot on Mastodon and somehow I created another bot. This one is called @DotBot and it creates a new piece of dot-based art once per day. (You can see an example above.)

I once again used Mastodon.py for this (GitHub and Docs) and there are twice as many lines of code for this one, which is still less than 50 lines. This one generates an image, saves it to disk, then posts that along with a small amount of text. A cron job kicks things off at 8:30am CST every day.

As for these dots? I realized it’s something I’ve been toying with for over a decade!

The image above was generated with a Processing sketch in April 2011. At that point I had probably been using Processing for less than a year. I had a lot of fun exploring creating images with code.

Here’s some fun I had with the images being projected onto a large while wall and taking photos of myself in front of it.

I found a folder dated September 2017 that had a bunch of generated images which I think I may have compiled into a video with each image being a frame. (I’ve done this other times, I just can’t find an output file for these. I probably did them last minute for the Maker Faire Milwaukee Dark Room and never got a chance to document them!)

I did find these images in the folder though… Not sure what I was doing, but I like it. If I had to dig up some related things I’d pick annular (more info) from 2013 and maybe Shape Grid Circles from 2019. I realized there are a few other related things but maybe they warrant their own post. Especially if I can find the videos. (If not, I can recreate them.)

Okay, that went a bit off course (of course) but the important thing is, if you’re on the Fediverse and want to see new dot-based colorful art each day, just follow @dotbot@botsin.space

And if you’re not on the Fediverse you can still get the RSS feed! Just grab https://botsin.space/@dotbot.rss

Note: The botsin.space server will shut down in December 2024.